The projects are generally designed to be viewed onscreen in a pdf viewer to allow for both full screen and the ability to zoom in on detail. Other times they are used as wall posters or even incorporated into learning content. See samples of my work below, for those times when a Microsoft Excel graph just wasn't going to cut it!
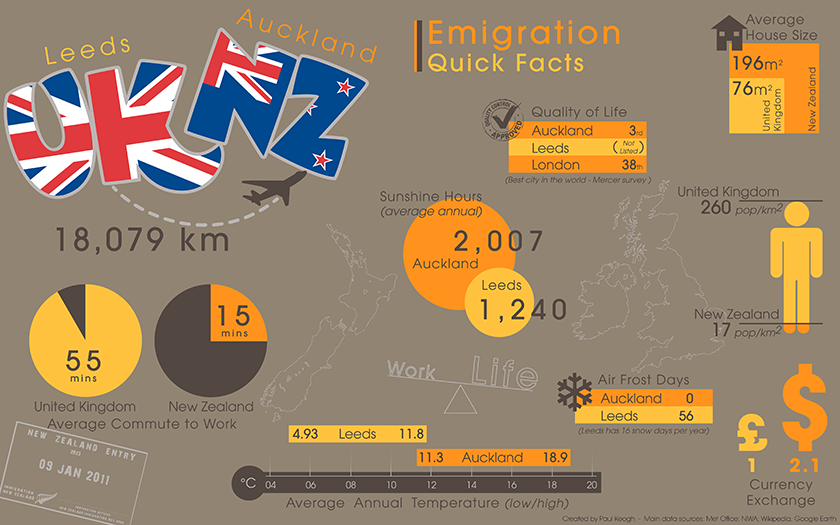
Emigration quick facts covers at a glance some of the more compelling reasons to move from the dreary North of England to Sunny Auckland in New Zealand. No snow, double the sunshine hours and a favourable exchange rate... Who wouldn't.
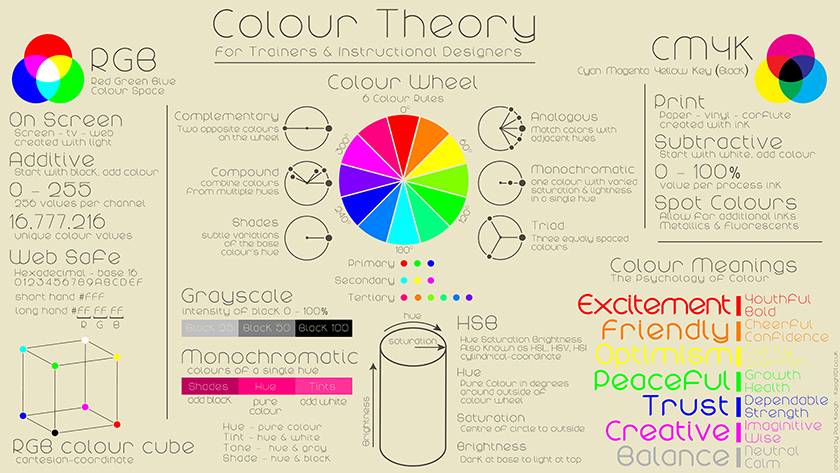
A basic colour space theory infographic for non designers, specifically commissioned as support material for corporate induction trainers creating their own learning resources.
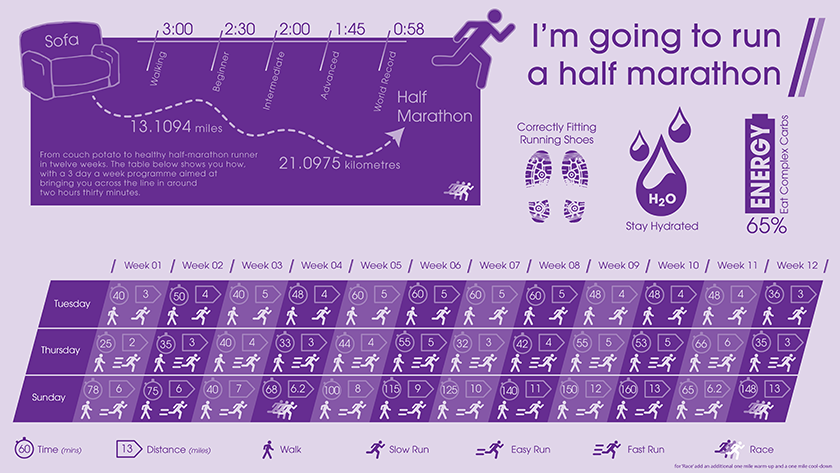
An adaptation of a five page text document outlining a half marathon training plan that is given to would be charity runners to aid in their preparations.
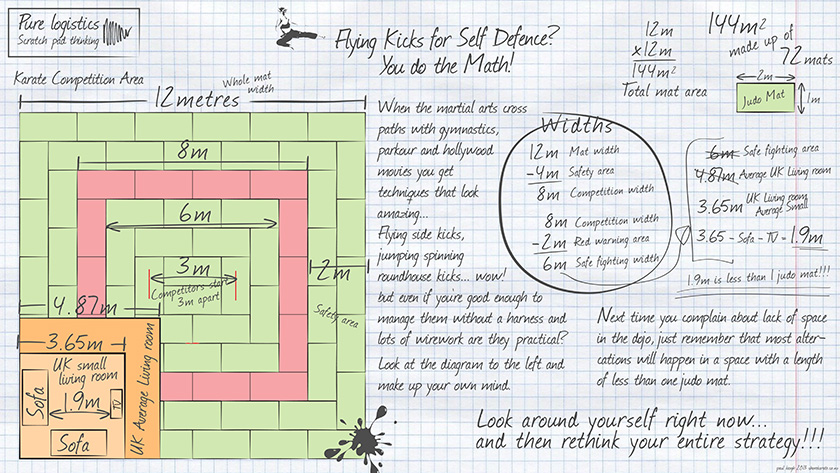
A scruffy, roughed up looking design for a martial arts discussion group. The brief being to graphically compare the size of training space to the size of living space, highlighting the flaw in a number of techniques.